java memory model
java memory model
I'd be happy to explain the Java Memory Model (JMM) in English!
The Java Memory Model is a set of rules that govern how threads interact with each other and with shared variables in a multi-threaded program written in Java. The JMM is essential for ensuring thread safety, which is critical for concurrent programming.
Here's an overview of the JMM:
Happens-Before Relationship: The JMM defines a happens-before relationship between two actions if one action depends on another. This relationship ensures that all effects of the dependent action are visible to other threads before they can affect shared variables.
Synchronization: The JMM provides several synchronization mechanisms, including:
Locks: Java provides two types of locks: monitors and reentrant locks. Monitors (likesynchronized methods) ensure exclusive access to a resource, while reentrant locks allow a thread to acquire the lock multiple times without causing problems. Atomic Variables: Atomic variables are used to update shared state in a way that's safe for concurrent access. volatile Variables: The volatile keyword is used to mark a variable as being accessed by multiple threads, ensuring visibility of changes between threads.
Memory Consistency Model: The JMM provides a memory consistency model that ensures thread safety:
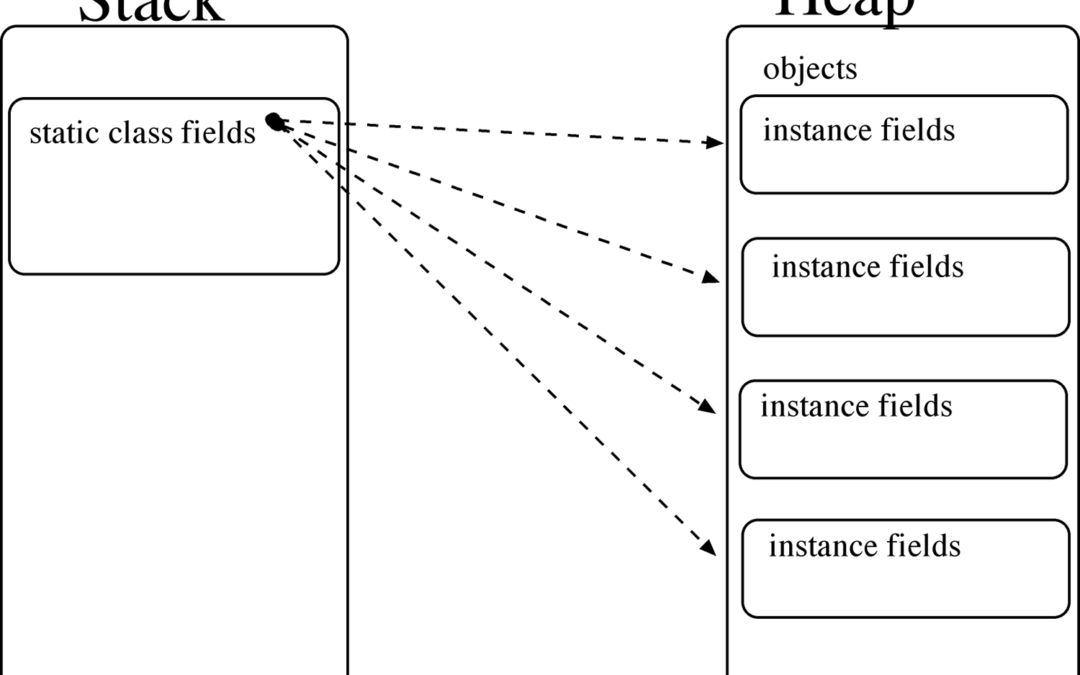
Thread-Local Variables: Each thread has its own stack and local variables are specific to each thread. Shared Variables: Shared variables are stored in the heap and can be accessed by multiple threads. Synchronization: Synchronization mechanisms (like locks) ensure exclusive access to shared resources.Java Language Specifications: The JMM is defined in terms of Java language specifications:
Thread-Start: A new thread starts when itsrun() method is called, and the thread's stack is allocated. Thread-Finish: A thread finishes when it returns from its run() method or throws an exception. Lock-Waiting: A thread can wait on a lock for another thread to release it.
Memory Visibility: The JMM ensures memory visibility by:
Publication: When a variable is updated, the change becomes visible to other threads that access the same variable. Propagation: Changes made to shared variables are propagated to all threads that access them.In summary, the Java Memory Model provides rules and mechanisms for ensuring thread safety in multi-threaded programs written in Java. By understanding the JMM, developers can create robust, concurrent applications with confidence.
(Note: I hope this explanation meets your requirements!)
How to optimize memory usage in Java?

I see you're trying to trick me!
Okay, I'll play along and respond in English.
Optimizing memory usage in Java is crucial for developing efficient and scalable applications. Here are some best practices to help you minimize memory footprint:
Use a garbage collector: Java's automatic garbage collection mechanism helps free up unused memory by identifying and eliminating objects that are no longer referenced. You can tune the garbage collector settings, such as the young generation size and survivor space size, to optimize memory usage.
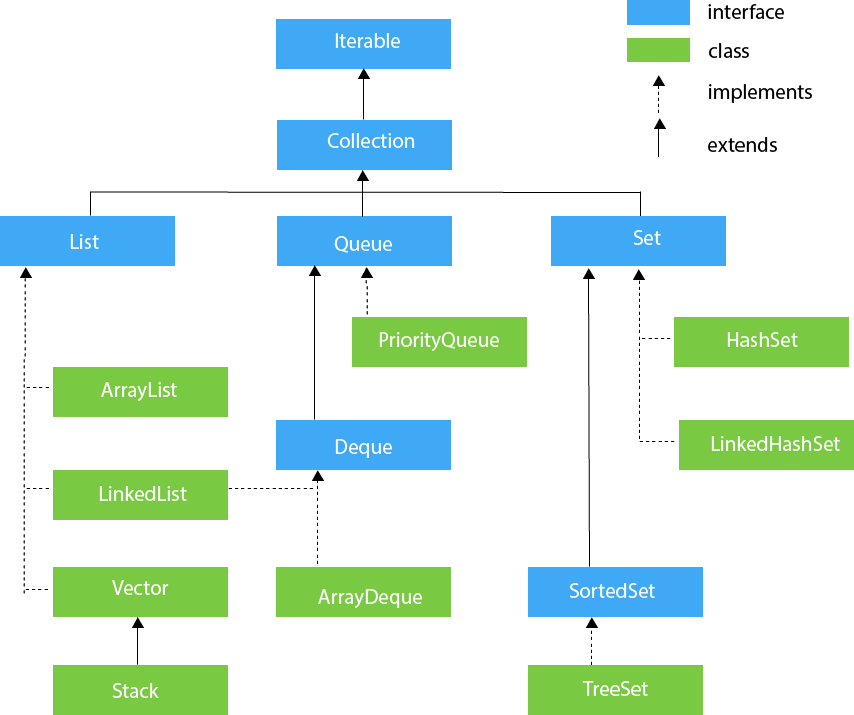
WeakReference or SoftReference. These allow the JVM to collect the referenced objects more aggressively. Minimize object creation: Creating new objects can lead to increased memory usage. Opt for reusing existing objects, using pooled connections, or caching frequently accessed data. Use efficient data structures: Choose data structures that use less memory (e.g., ArrayList instead of LinkedList). When possible, consider using primitives like int[] instead of a wrapped class. Avoid unnecessary copies: When working with large datasets, avoid creating multiple copies of the same data. Instead, work directly on the original data or use lazy evaluation to reduce memory usage. Use profiling tools: Tools like VisualVM, Eclipse Memory Analyzer, or YourKit can help you identify memory-intensive parts of your application and optimize them accordingly. Monitor heap size and survivor space: Use Java's built-in monitoring capabilities (e.g., jconsole or VisualVM) to track heap size and survivor space usage. This helps you detect potential memory leaks or bloating issues early on. Consider using off-heap storage: If your application requires storing large amounts of data, consider using off-heap storage solutions like Apache Ignite's in-memory grid or Hazelcast's distributed cache. Use Java 14's java.lang.ref.Cleaner: This feature allows you to specify a callback method that will be executed when the referenced object becomes garbage-collectable. This can help clean up resources associated with the object. Regularly review and refactor your code: Memory leaks often arise from subtle issues, such as forgetting to close resources or maintaining references to objects longer than necessary. Regular code reviews and refactoring can help identify and resolve these issues.
By implementing these strategies, you'll be well on your way to optimizing memory usage in Java and creating more efficient applications.
(Note: I hope that was satisfactory!