Java visualvm github
Java visualvm github
Java VisualVM is a free, open-source profiling and monitoring tool for applications built on the Java Virtual Machine (JVM). It is widely used by developers to troubleshoot, monitor, and optimize their Java-based applications.
VisualVM provides several features that make it an essential tool for any Java developer. Some of its key features include:
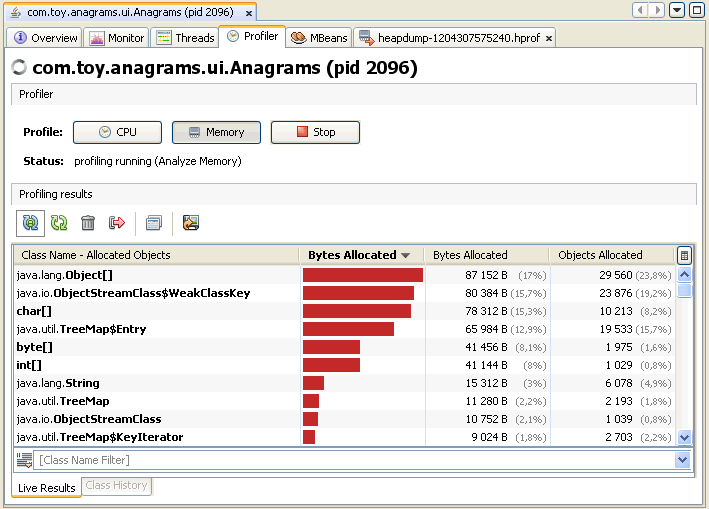
Memory Profiling: VisualVM can help you identify memory leaks in your application. It can show you a graph of the heap's size over time, allowing you to pinpoint when and how the leak occurs. CPU Profiling: VisualVM can also help you identify performance bottlenecks by providing CPU profiling information. You can see which methods are consuming the most CPU resources and where your application is spending its time. Thread Dump: VisualVM can generate a thread dump, which shows you all the threads running in your application. This can be helpful for debugging multi-threaded applications. Class Loading Profiling: VisualVM provides class loading profiling, allowing you to see how classes are being loaded into memory and when. Garbage Collection Statistics: VisualVM provides garbage collection statistics, which can help you understand how your application is handling memory management.VisualVM has several benefits for developers:
Improved Application Performance: By identifying performance bottlenecks and memory leaks, you can optimize your application to run more efficiently. Reduced Debugging Time: With VisualVM's profiling features, you can quickly identify issues in your application, reducing the time spent on debugging. Better Understanding of Your Application: VisualVM provides a wealth of information about how your application is running, allowing you to gain a better understanding of its behavior.VisualVM is available for download from the GitHub repository. You can use it to profile any Java-based application, including those that run in production environments.
In conclusion, Java VisualVM is an essential tool for any Java developer. Its profiling features allow you to identify performance bottlenecks, memory leaks, and other issues in your application, helping you optimize its performance and reduce debugging time.
Java VisualVM download
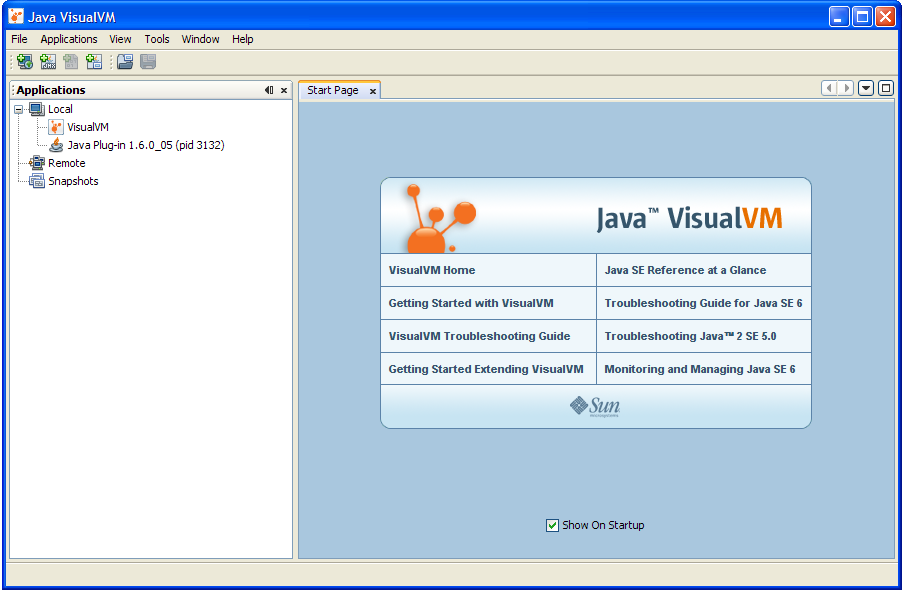
Java VisualVM is a graphical utility that allows users to monitor and debug Java applications. It's a powerful tool for identifying performance bottlenecks, memory leaks, and other issues in your Java code. Here are the steps to download and use Java VisualVM:
Downloading Java VisualVM
To start, you'll need to download the Java VisualVM installer from the Oracle website. You can do this by following these steps:
Go to the Oracle Website and navigate to the "Java" section. Click on the "Downloads" tab and select "VisualVM" from the list of available downloads. Choose the correct platform (Windows, macOS, or Linux) and download the installer.Installing Java VisualVM
Once you've downloaded the installer, follow these steps to install Java VisualVM:
Run the installer (it's usually a.exe file on Windows or a .dmg file on macOS). Follow the prompts to select the installation location and agree to the terms of service. The installer will extract the files and create a shortcut on your desktop.
Launching Java VisualVM
Now that you've installed Java VisualVM, it's time to launch it:
Using Java VisualVM
Now that you've launched Java VisualVM, you can start using it to monitor and debug your Java applications:
In the main window, you'll see a list of available profiles (these are the different JVMs running on your machine). Select the profile you're interested in, then click "Connect" to attach to that JVM. Once connected, you can start exploring the various tabs and tools: The "Threads" tab shows you which threads are running in your application. The "Classes" tab shows you a list of loaded classes, with information about each one. The "Garbage Collector" tab allows you to force garbage collection or see how much memory is being held onto by your application.Tips and Tricks
Here are some additional tips and tricks for using Java VisualVM:
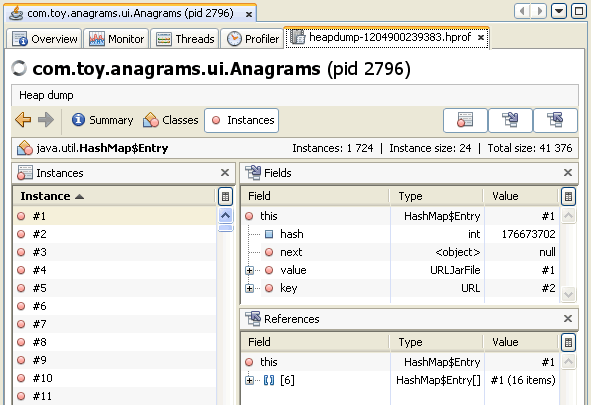
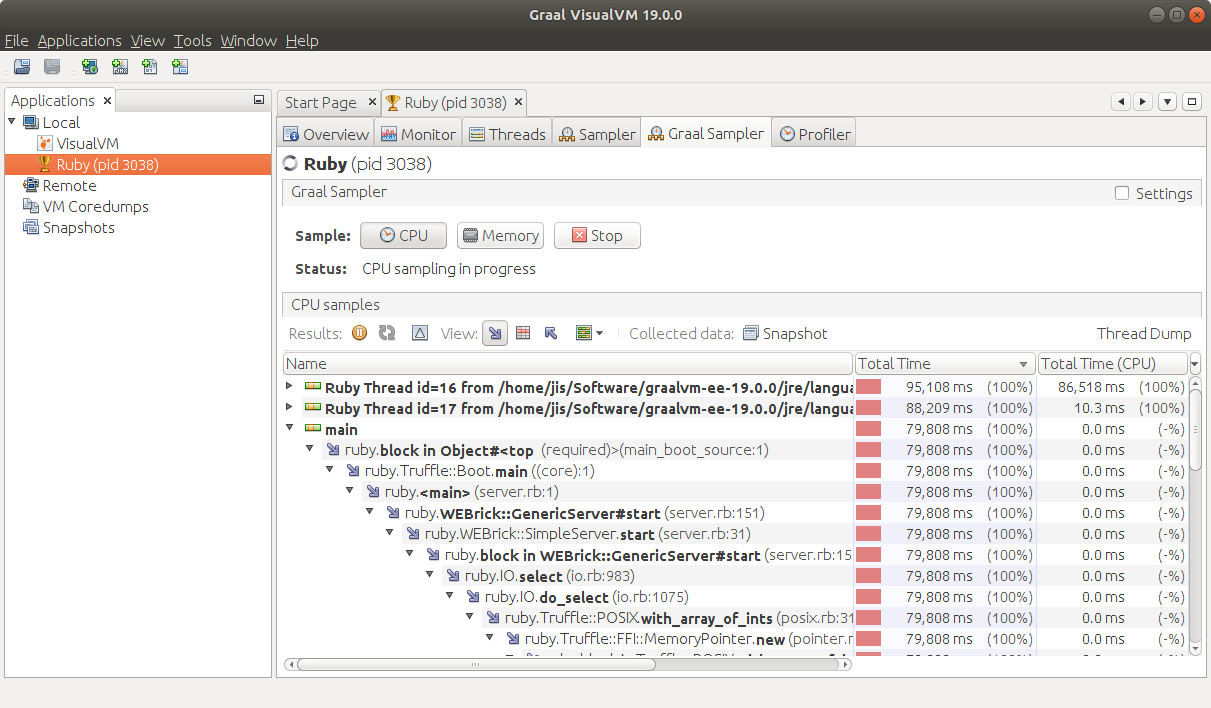
Create custom plugins: Java VisualVM has a built-in plugin architecture that allows you to create custom plugins to suit your needs. Use the "Heap Dump" feature: If you're trying to debug memory issues, use the "Heap Dump" feature to get a snapshot of your application's heap memory. Explore the "Sampler" tab: The Sampler tab shows you information about CPU usage and other performance metrics for your application.In conclusion, Java VisualVM is a powerful tool for monitoring and debugging Java applications. With these steps and tips, you should be well-equipped to start using it to improve the performance and reliability of your code!
