How to improve Java performance?
How to improve Java performance?

Here's a comprehensive guide on how to improve Java performance:
1. Optimize your code:
Arrays.sort() or List.sort(). Avoid recursive methods, which can cause stack overflow issues.
2. Profile your application:
Use Java Mission Control (JMC) to profile your application and identify performance bottlenecks. JMC provides a detailed view of your application's memory usage, CPU usage, and other performance metrics.3. Optimize memory management:
Minimize garbage collection pauses by reducing object creation and usingArrays.copyOf() instead of Arrays.asList(). Use System.gc() to trigger garbage collection manually. Consider using a Java profiler like Eclipse MAT or YourKit Profiler to analyze heap usage and identify memory leaks.
4. Leverage Java 8 features:
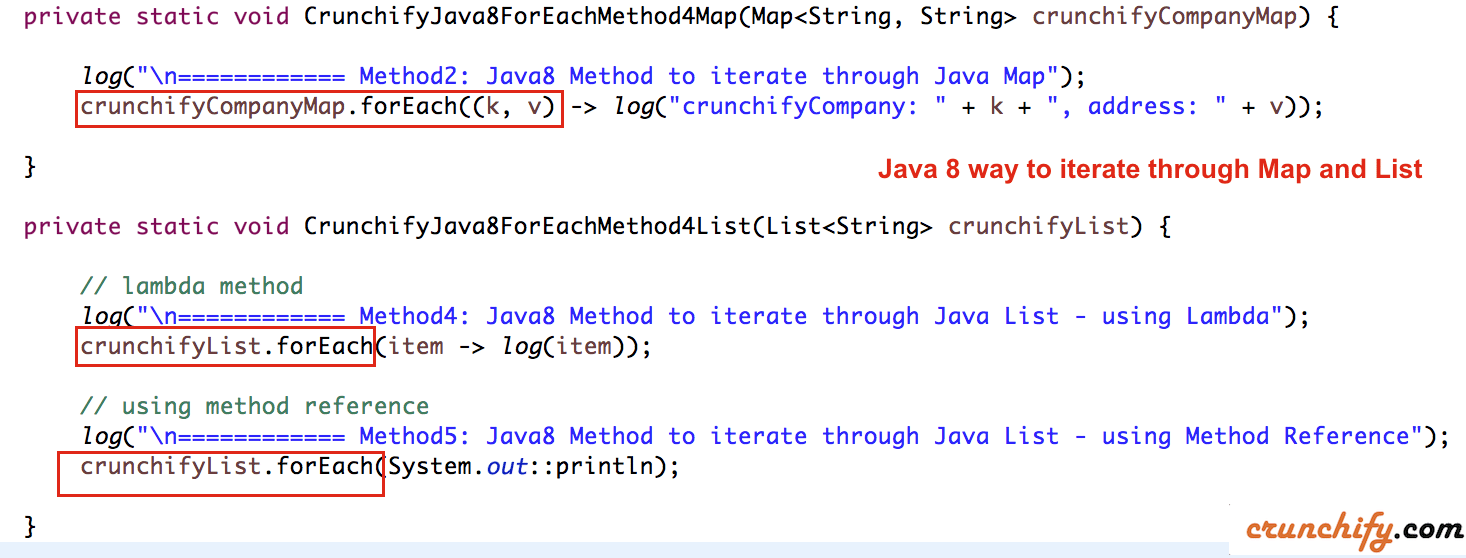
Use lambda expressions and method references to reduce boilerplate code and improve readability. Take advantage of functional programming features likeStream API for efficient data processing. Use the Optional class to safely handle null values and avoid NullPointerExceptions.
5. Improve database performance:
Use connection pooling and batching to minimize the number of database connections. Optimize database queries by using indexes, views, and stored procedures. Consider using a caching layer like EhCache or Redis to reduce the load on your database.6. Minimize I/O operations:
Use buffering and caching to reduce the number of disk reads and writes. Avoid unnecessary file accesses and use memory-mapped files instead. Optimize file compression and decompression for faster data transfer.7. Optimize network performance:
Use connection pooling and keep-alive headers to minimize socket creation. Optimize HTTP requests by using caching, pipelining, and chunked encoding. Consider using a load balancer or content delivery network (CDN) to distribute traffic and improve response times.8. Monitor system resources:
Use the Java Management Extensions (JMX) API to monitor JVM metrics like CPU usage, memory usage, and garbage collection. Monitor system resources like disk space, CPU usage, and network bandwidth using tools liketop, htop, or iostat.
9. Upgrade your hardware:
Ensure your computer's CPU, RAM, and hard drive are sufficient for the task at hand. Consider upgrading to a solid-state drive (SSD) for faster disk I/O.10. Consider alternative JVMs:
Oracle JDK and OpenJDK are popular choices, but you may also consider alternative JVMs like Azul Zing or GraalVM. Each JVM has its own set of features, performance characteristics, and limitations, so choose the one that best fits your needs.By following these guidelines, you should be able to significantly improve the performance of your Java application. Happy coding!
java performance tuning interview questions
Here are some Java performance tuning interview questions that you may find helpful:
General Performance Tuning
What is the main difference between profiling and tracing in Java? Profiling measures the time spent by an application to execute a particular method or code path, whereas tracing captures information about what happened during the execution of an application. How do you determine if your Java application is experiencing performance issues? By monitoring system resources (CPU usage, memory utilization), analyzing logs and error messages, and reviewing performance metrics such as response time, throughput, and CPU usage. What are some common Java performance tuning techniques? Tuning garbage collection parameters, optimizing database queries, reducing unnecessary object creation, minimizing network latency, and using caching mechanisms.Garbage Collection
How do you troubleshoot Java heap space issues in an application? By analyzing memory dumps, reviewing heap size settings, checking for excessive object creation, monitoring system resources (CPU usage, memory utilization), and identifying garbage collection pauses. What is the difference between G1 and Concurrent Mark-and-Sweep (CMS) garbage collectors in Java? G1 is a low-pause-time garbage collector designed to reduce pause times during full GC cycles, whereas CMS is designed for low-pause-time concurrent marking with a separate concurrent sweeping phase. How do you tune the garbage collection settings in your Java application? By adjusting parameters such as heap size, garbage collection frequency, and concurrency level based on performance metrics analysis.Multithreading
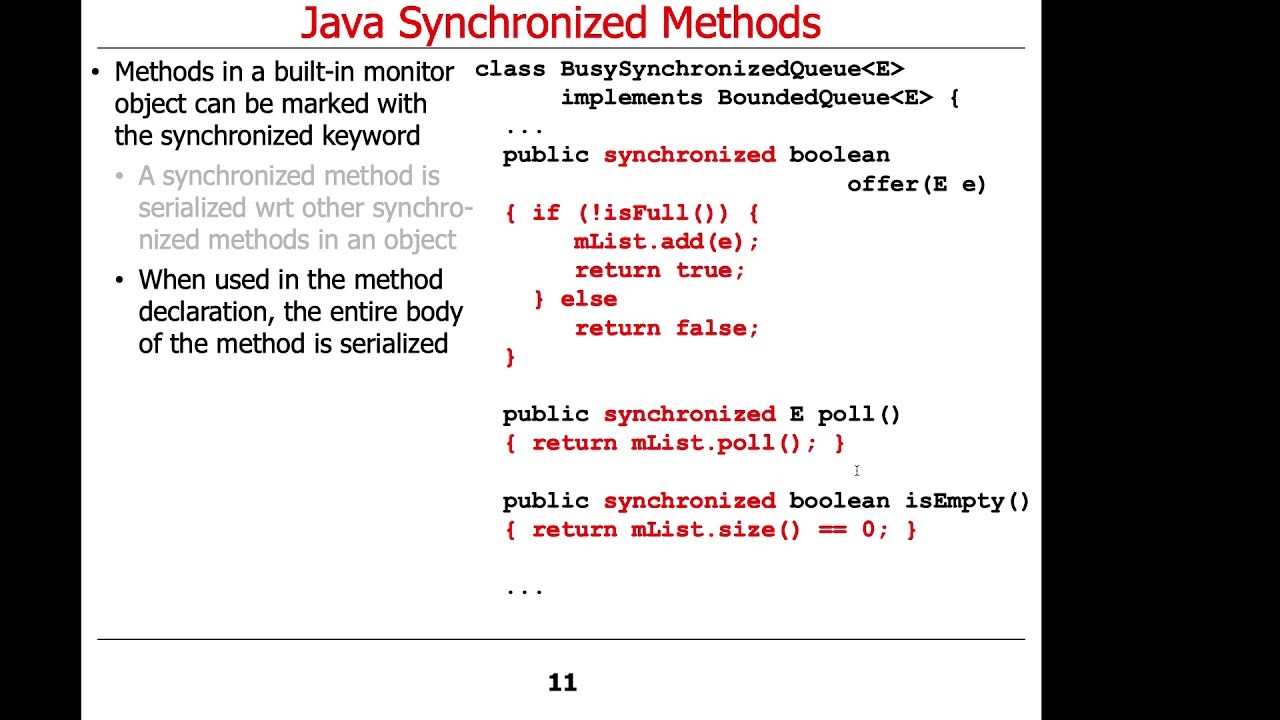
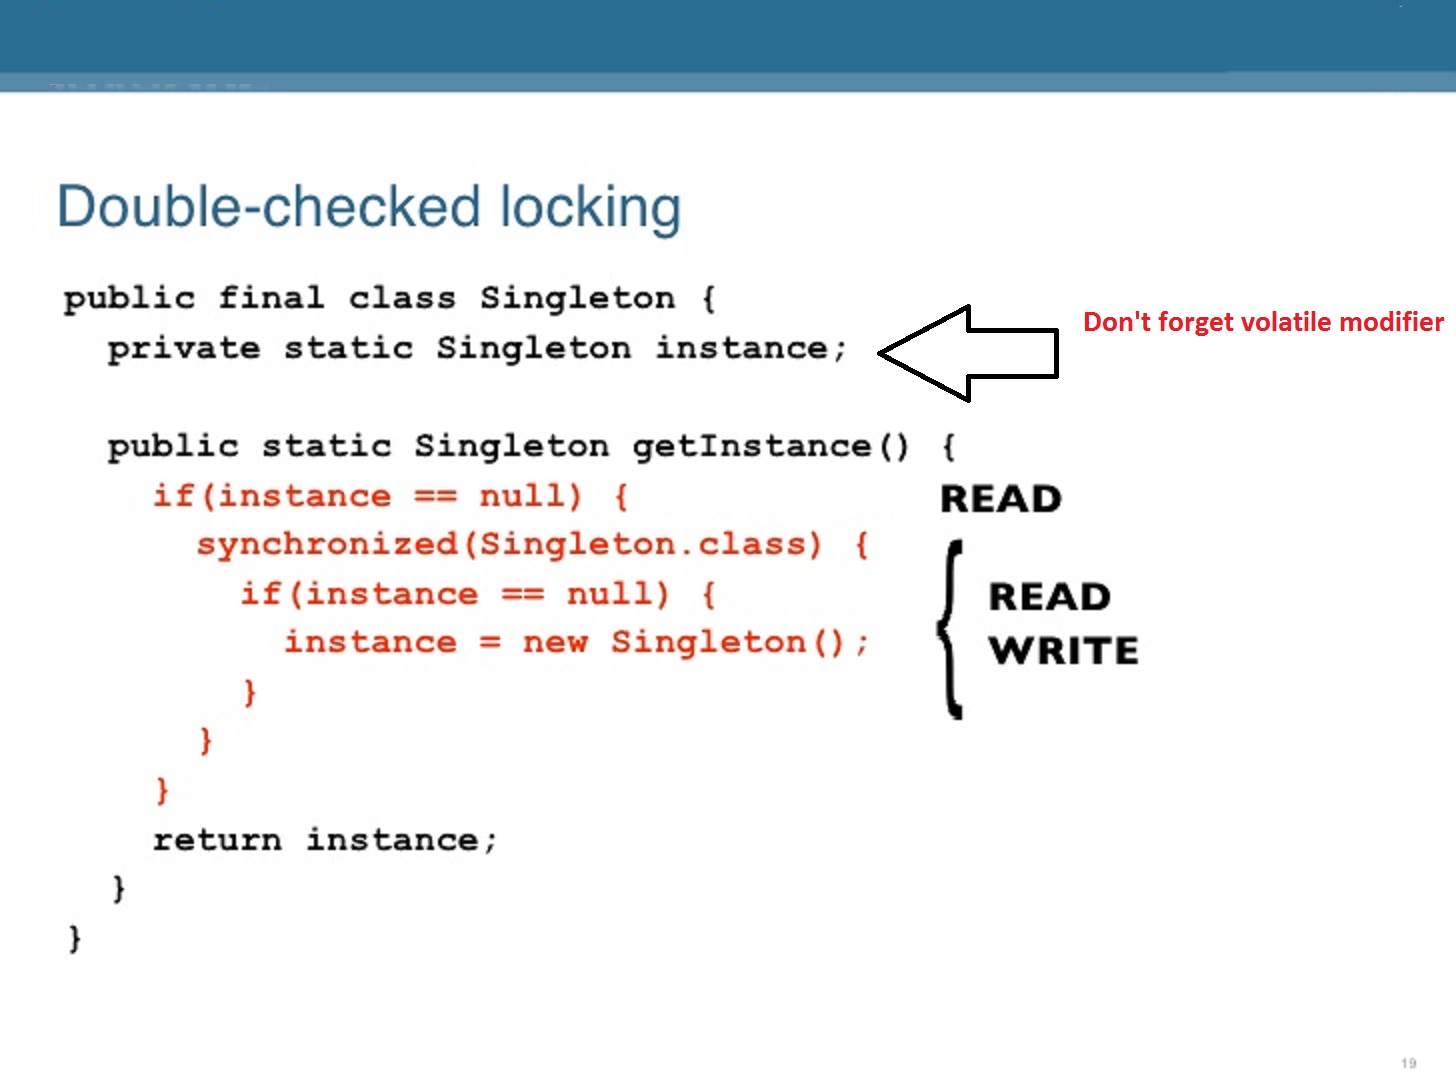
What are some common Java multithreading performance tuning techniques? Minimizing thread creation overhead, using executor services to manage threads, optimizing lock contention, reducing unnecessary synchronization, and using thread-local variables. How do you troubleshoot Java multithreading issues such as deadlocks or starvation? By analyzing thread dumps, reviewing lock order invariants, identifying synchronization bottlenecks, monitoring thread pools and queues, and verifying correct use of thread-safe data structures. What is the difference between a producer-consumer queue and a thread pool in Java? A producer-consumer queue allows multiple threads to produce or consume items from a shared buffer, whereas a thread pool manages a fixed number of worker threads that execute tasks submitted by a producer thread.Database
How do you optimize database queries in a Java application? By indexing relevant columns, optimizing query plans, reducing unnecessary joins and subqueries, using connection pooling and batching, and minimizing network latency. What are some common Java performance tuning techniques for working with databases? Using prepared statements to reduce parsing overhead, caching database queries, optimizing data retrieval and processing, and minimizing transactional complexity. How do you troubleshoot Java database performance issues such as slow query execution or high connection latency? By analyzing database logs, reviewing SQL query plans, monitoring system resources (CPU usage, memory utilization), checking for excessive query parameterization, and identifying indexing opportunities.Networking
What are some common Java performance tuning techniques for improving network communication? Minimizing network round-trips by optimizing message sizes and payload compression, using connection pooling and multiplexing, reducing unnecessary serialization/deserialization, and prioritizing high-priority requests. How do you troubleshoot Java network performance issues such as slow data transfer or high latency? By analyzing network statistics (packet loss, latency), reviewing socket configuration options, checking for excessive garbage collection pauses during network I/O operations, and verifying correct use of sockets and streams. What is the difference between a HTTP client and a WebSocket connection in Java? A HTTP client sends HTTP requests to a server and receives responses, whereas a WebSocket connection enables bidirectional communication between a browser or application and a server over a single socket.Remember to provide specific examples and scenarios when answering these questions, and be prepared to explain your thought process and problem-solving skills.
