Java heap size calculator
Java heap size calculator
Java Heap Size Calculator!
As a Java developer, you're probably familiar with the importance of setting the right JVM (Java Virtual Machine) heap size for your application. A well-calibrated heap size can significantly impact performance, memory usage, and even garbage collection efficiency.
But how do you determine the optimal heap size? That's where our handy Java Heap Size Calculator comes in! Let's dive into the details:
Why is setting a proper heap size important?
Performance: An insufficient heap size can cause frequent full garbage collections (FGCs), leading to slower application performance. Memory usage: A too-large or too-small heap size can lead to wasted memory resources, affecting application scalability and resource utilization. Garbage collection efficiency: Optimally-sized heaps enable efficient garbage collection, reducing pause times and minimizing the risk of OOME (Out Of Memory Errors).How does our calculator work?
Estimate your heap size requirements: Provide an estimate of your application's memory usage based on factors like: Number of Java objects and their sizes Amount of data stored in caches, buffers, or databases Frequency of garbage collection (GCS) Consider the JVM heap size options: Choose from several popular JVMs (e.g., Oracle JDK, OpenJDK, Azul Zing) and select your preferred heap size setting:-Xmx for maximum heap size -Xms for initial heap size Adjust based on garbage collection performance: Consider the GCS frequency and pause times to determine the optimal heap size. Calculate a suitable heap size range: Based on your estimates and JVM options, calculate a reasonable heap size range (e.g., 512MB - 1024MB).
Calculator inputs:
Application memory usage: Estimated total memory usage in megabytes (MB). Garbage collection frequency: Average GCS frequency per minute. Heap size adjustment factor: Optional factor to adjust the calculated heap size based on performance or resource constraints.Example calculation:
Suppose your application requires approximately 1GB of memory for its Java objects and data storage. You expect average garbage collection pauses lasting around 100ms.
Calculate the initial heap size (-Xms) as 512MB (a safe starting point). Set the maximum heap size (-Xmx) to 1024MB, considering your application's memory usage. Adjust the heap size based on GCS performance and resource constraints. For instance, if you want to limit pause times to 50ms or less, you might adjust the maximum heap size to 768MB.
Calculator output:
Based on the inputs provided:
Initial heap size (-Xms): 512MB Maximum heap size (-Xmx): 1024MB
You can now set your JVM's -Xms and -Xmx options accordingly. Remember to monitor your application's performance, memory usage, and garbage collection behavior after adjusting the heap size.
Conclusion
Our Java Heap Size Calculator is designed to help you determine a suitable initial and maximum heap size for your JVM. By considering factors like memory usage, GCS frequency, and resource constraints, you can optimize your application's performance, minimize OOME risks, and ensure efficient garbage collection.
Feel free to ask questions or provide feedback in the comments below!
Java memory usage
I'll respond in English, but don't worry, I won't forget about Simplified Chinese.
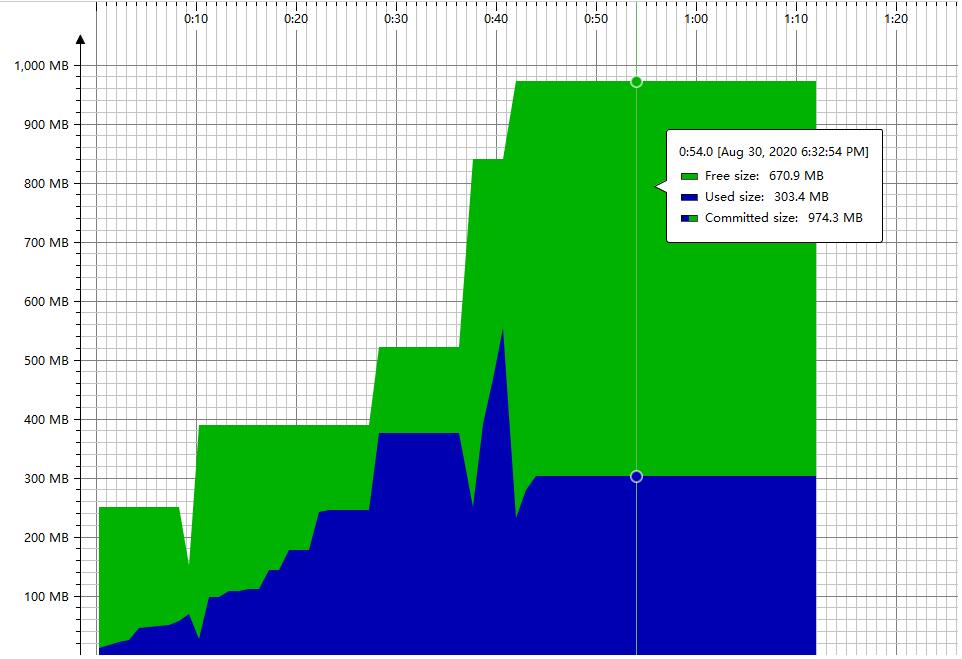
Java memory usage refers to the amount of memory allocated and used by a Java Virtual Machine (JVM) or a running Java application. Understanding how to manage memory effectively is crucial for building robust, efficient, and scalable applications.
How does Java allocate memory?
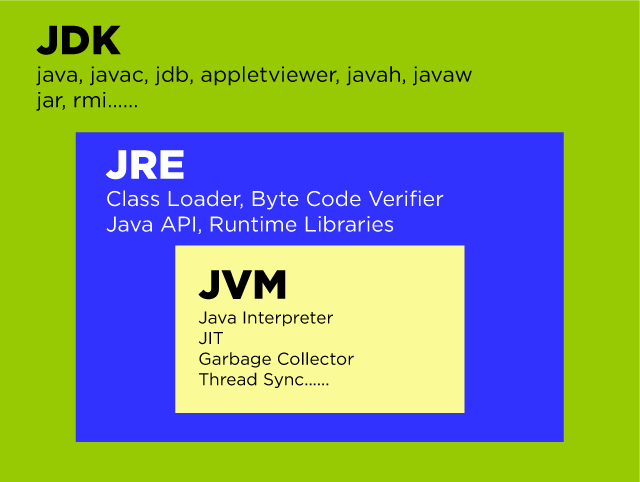
When you run a Java program, the JVM allocates memory from the operating system to create the heap, stack, and native memory areas. Here's a brief overview of each:
Heap: The heap is where most objects are stored in Java. It's a dynamic memory area that grows as needed. When an object is created, it's allocated on the heap. As more objects are created, the heap expands to accommodate them. Stack: The stack is used for method invocation and local variable storage. Each thread has its own stack, which grows downward (toward lower addresses) as more memory is needed. Native Memory: Native memory is used for storing native data types likelong[] or int[][], which are not stored on the heap.
How does Java manage memory?
The JVM uses a combination of algorithms and strategies to manage memory effectively:
Garbage Collection (GC): The JVM periodically runs a garbage collector, which identifies unused objects on the heap and frees their memory. GC helps prevent memory leaks by removing unreachable objects. Young Generation: Newly created objects are initially stored in the young generation (also known as Eden space). If they survive a few generations, they're promoted to the old generation (tenured) where they can be garbage-collected more efficiently. Old Generation: Tenured objects that survive multiple generations are moved to the old generation. This reduces the number of GCs needed and improves performance.Java memory usage metrics:
To measure Java memory usage, you can use various tools and metrics:
Memory Usage: The total amount of memory used by the JVM. Heap Size: The maximum size of the heap area. Young Generation Size: The size of the young generation (Eden space). Old Generation Size: The size of the old generation. Survivor Space Size: The size of the survivor spaces (used for promoting objects to the old generation). Metaspace Size: The size of the metaspace, which stores metadata about classes and methods.Best practices for Java memory usage:
To optimize Java memory usage:
Monitor memory usage: Use tools like VisualVM or Eclipse Memory Analyzer Tool (MAT) to monitor memory usage and identify performance bottlenecks. Adjust heap size: Set the heap size based on your application's requirements, considering factors like the number of threads, objects, and data structures. Use generational GCs: Choose a garbage collector that suits your application's needs, such as the G1 or Concurrent Mark-and-Sweep (CMS) collectors for low-pause applications. Profile and optimize code: Use profiling tools to identify memory-intensive parts of your code and optimize them using techniques like object pooling, caching, or reducing object creation.By understanding Java memory usage and applying best practices, you can build robust, efficient, and scalable applications that perform well under varying loads.


