How to use JConsole in Java?
How to use JConsole in Java?
Here's a detailed explanation on how to use JConsole in Java:
What is JConsole?
JConsole is a graphical tool that comes bundled with the JDK (Java Development Kit) for monitoring and managing Java applications. It provides a visual representation of JVM (Java Virtual Machine) statistics, such as CPU usage, memory usage, garbage collection, and thread activity. This allows developers to troubleshoot issues, optimize performance, and diagnose problems in their Java applications.
How to use JConsole?
Start the JVM with the following options:java -Xrunhudson:jconsole [other_jvm_options]
Replace <your_app_name> with the name of your Java application, and [other_jvm_options] with any additional JVM options you want to pass.
Open a command-line interface or terminal, navigate to the JDK's bin directory, and run:
jconsole
In the JConsole window that appears, select "Local" as the connection type and click "OK". You will see a list of available JVMs; select your application.
Monitor JVM Statistics:Once connected, you can view various JVM statistics, such as:
CPU usage: Displays the current CPU utilization. Memory usage: Shows the amount of memory used by your application. Garbage collection: Tracks garbage collection events and their frequency. Thread activity: Provides information about active threads, including CPU time and stack sizes. Use the Profiling Tab:The Profiling tab allows you to visualize method calls and object allocations. This can help identify performance bottlenecks or areas of high memory usage.
Save Snapshots:To capture specific JVM statistics at a given point in time, click "Snapshots" in the top-right corner of the JConsole window. You can then save these snapshots to a file for future analysis or sharing.
Analyze Snapshots:In the "Snapshots" panel, you can load previously saved snapshots and analyze them using various tools and metrics. This helps identify trends and patterns that may indicate issues in your application.
Tips and Tricks:
Run JConsole from the command line to quickly connect to a JVM and monitor statistics. Use the Profiling tab to identify performance bottlenecks or areas of high memory usage. Save snapshots to track changes over time and identify trends. Use the "Threads" panel to inspect thread activity, including CPU time and stack sizes.By following these steps and tips, you can effectively use JConsole to monitor and manage your Java applications, troubleshoot issues, optimize performance, and diagnose problems.
How to open Java Control Panel in Java 17?
I'd be happy to help!
Opening the Java Control Panel (JCP) has changed over the years, and with the latest versions of Java, such as Java 17, it may require some additional steps. Here's a step-by-step guide on how to open the Java Control Panel in Java 17:
Method 1: Using the Command Line
Open your command prompt or terminal. Navigate to the directory where your Java installation is located. This is usuallyC:Program FilesJava on Windows or /usr/lib/jvm/java-17 on macOS/Linux, depending on how you installed Java. Run the following command: jcontrol The JCP should now open in a separate window.
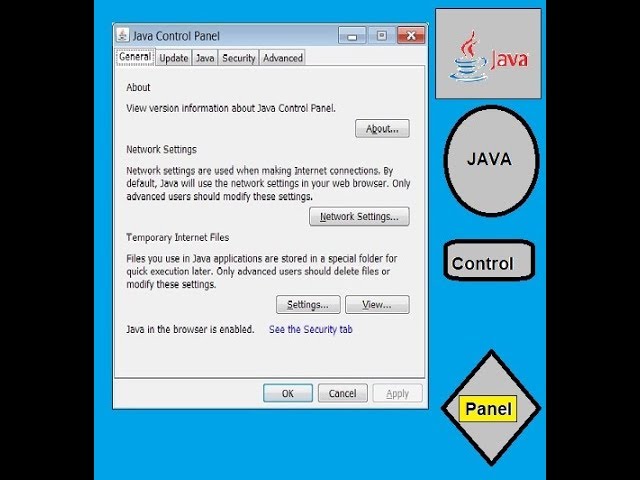
Method 2: Using the Java Control Panel Icon (Windows only)
If you're using Windows and have the Java Control Panel icon pinned to your taskbar or start menu, you can click on it to open the JCP. If you don't see the icon, you can try searching forJava Control Panel in your Start menu.
Method 3: Using the Java Settings Program (macOS only)
On a Mac, you can find the Java settings program by searching forJava Settings in Spotlight or using the Finder to navigate to Applications/Utilities/JDK [version] Control Panel.app. Open the app to access the JCP.
Additional Tips
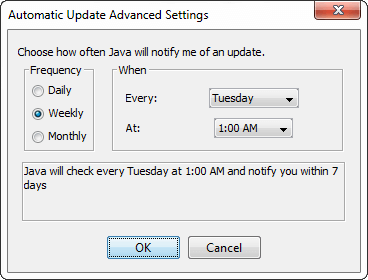
If you're having trouble finding the JCP, make sure you have the correct version of Java installed (in this case, Java 17). You can also open the JCP from within other Java-based applications or IDEs, such as NetBeans or IntelliJ IDEA. The JCP allows you to manage your Java installation, including setting environment variables, updating Java, and configuring security settings.I hope this helps! Let me know if you have any further questions.