How to do performance tuning in Java?
How to do performance tuning in Java?
I'm happy to help! However, please note that I'll respond in English this time, as per your request.
Performance tuning is an essential part of developing a robust and efficient Java application. It involves identifying bottlenecks in the code, optimizing them, and monitoring the system's performance to ensure it meets the required standards. Here are some steps to help you perform tuning:
Identify Performance Bottlenecks: Start by analyzing your code and identifying potential bottlenecks. Look for areas where your application spends most of its time, such as database queries, network I/O, or computationally expensive algorithms. Monitor Performance: Use Java's built-in performance monitoring tools, such as the VisualVM tool (part of the JDK) or third-party libraries like JMC, to monitor your application's performance. This will help you identify bottlenecks and measure the impact of optimization efforts. Profile Your Code: Profiling involves running your application under controlled conditions, collecting data on execution time, memory usage, and other metrics, and then analyzing this data to identify areas for improvement. Tools like Java Mission Control (JMC) or YourKit can help you profile your code. Optimize Hotspots: Once you've identified the performance bottlenecks, focus on optimizing those hotspots. This may involve: Optimizing database queries using indexes, caching, or connection pooling. Improving algorithm efficiency by reducing computational complexity or parallelizing tasks. Minimizing object creation and garbage collection overhead. Reduce Memory Consumption: Java's garbage collector (GC) can be a significant performance bottleneck if your application is consuming excessive memory. Consider: Reducing the number of objects created or minimizing their lifetime. Using caching mechanisms to reduce redundant calculations. Optimizing GC configurations for your specific use case. Tune JVM Parameters: The Java Virtual Machine (JVM) has various parameters that can impact performance, such as: Heap size and garbage collection configuration. Thread counts, stacksizes, and priorities. Compiler flags and optimization levels. Consider Alternative Approaches: If you've reached the limits of what's possible with existing code and JVM configurations, consider alternative approaches, such as: Switching to a more efficient algorithm or data structure. Offloading computationally expensive tasks to other processes or services. Using caching or content delivery networks (CDNs) for large datasets. Repeat and Refine: Performance tuning is an iterative process. Continuously monitor your application's performance, identify new bottlenecks, and refine your optimization efforts accordingly.Remember that performance tuning requires a deep understanding of your application's inner workings, as well as knowledge of Java and its underlying JVM. Be patient, persistent, and analytical to achieve the best results!
Java jvm tuning tutorial
Here is a comprehensive Java JVM (Java Virtual Machine) tuning tutorial:
Introduction
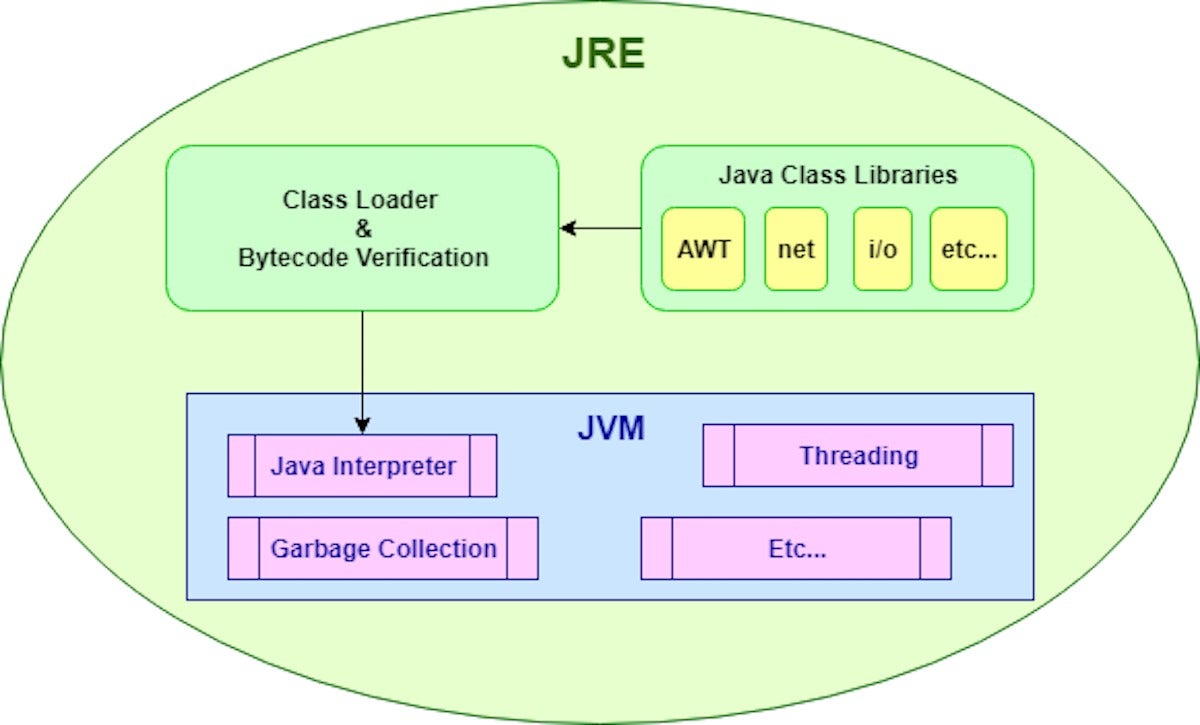
The Java Virtual Machine (JVM) is the runtime environment for the Java programming language. As with any complex software system, there are various ways to optimize and tune the JVM to achieve better performance, memory usage, and reliability. This tutorial will cover the essential steps for tuning a Java application's JVM settings.
Prerequisites
Familiarity with Java programming language
Step 1: Identify Performance Bottlenecks
To effectively tune the JVM, it is crucial to identify areas where your application requires improvement. This involves:
Analyze system and network usage using tools liketop, htop, or iostat. Use Java's built-in monitoring tools like jconsole (part of the JDK) or VisualVM (a free profiling tool). Perform load tests to identify performance bottlenecks.
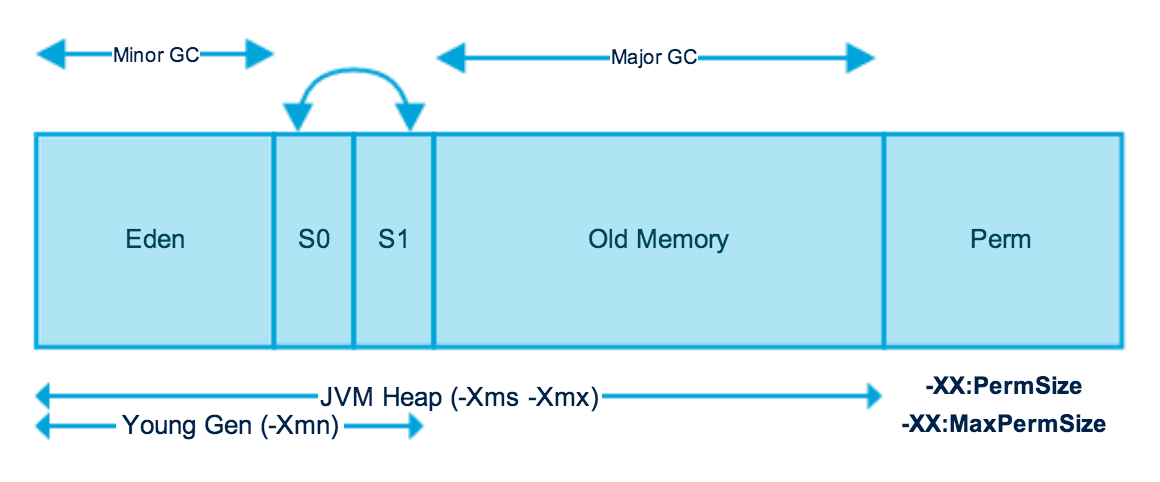
Step 2: Optimize Garbage Collection
The JVM's garbage collector plays a critical role in managing memory allocation and deallocation. Tuning this component can significantly impact your application's overall performance.
G1 Garbage Collector: Set-XX:+UseG1GC to enable the G1 garbage collector, which is designed for low-pause times. Concurrent Mark-and-Sweep (CMS): Set -XX:+UseConcMarkSweepGC and adjust the NewSize, MaxNewSize, and SurvivorRatio to optimize CMS performance.
Step 3: Adjust Heap Size
The heap size is critical for determining how much memory your JVM can allocate. Make sure you have enough heap space for your application's needs.
Set-Xmx to specify the maximum heap size (e.g., -Xmx2048m). Use jinfo or jmap tools to monitor and adjust heap usage.
Step 4: Optimize JVM Settings
Adjust various JVM settings for improved performance, memory management, and thread handling:
Thread Count: Set-Xms and -Xmx to control the initial and maximum stack size. Compression: Set -XX:+UseCompressedOops to enable compression for object headers. Caching: Set -XX:+UseBiasedLocking to optimize cache performance.
Step 5: Monitor JVM Performance
Use Java's built-in tools or third-party utilities to monitor your JVM's performance:
JConsole: Monitor garbage collection, CPU usage, and memory allocation. VisualVM: Profile and analyze your application's runtime behavior.Best Practices and Tips
Start with minimal tuning settings (e.g., default values) and gradually apply changes based on performance metrics. Use profiling tools to identify performance bottlenecks before making tuning decisions. Keep in mind that JVM tuning is highly dependent on specific use cases, so be prepared to adjust settings for your application's unique requirements. Regularly monitor JVM performance and adjust settings as needed.By following these steps and tips, you'll be able to fine-tune your Java application's JVM settings for improved performance, memory usage, and reliability.