Best java performance optimization tools
Best java performance optimization tools

I'd be happy to help!
When it comes to optimizing Java application performance, there are several excellent tools that can help you identify and address bottlenecks. Here are some of the best ones:
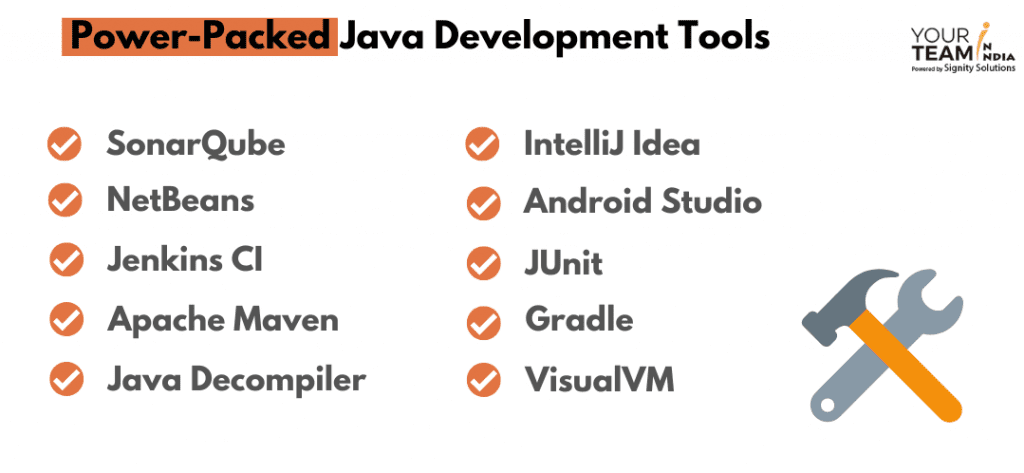
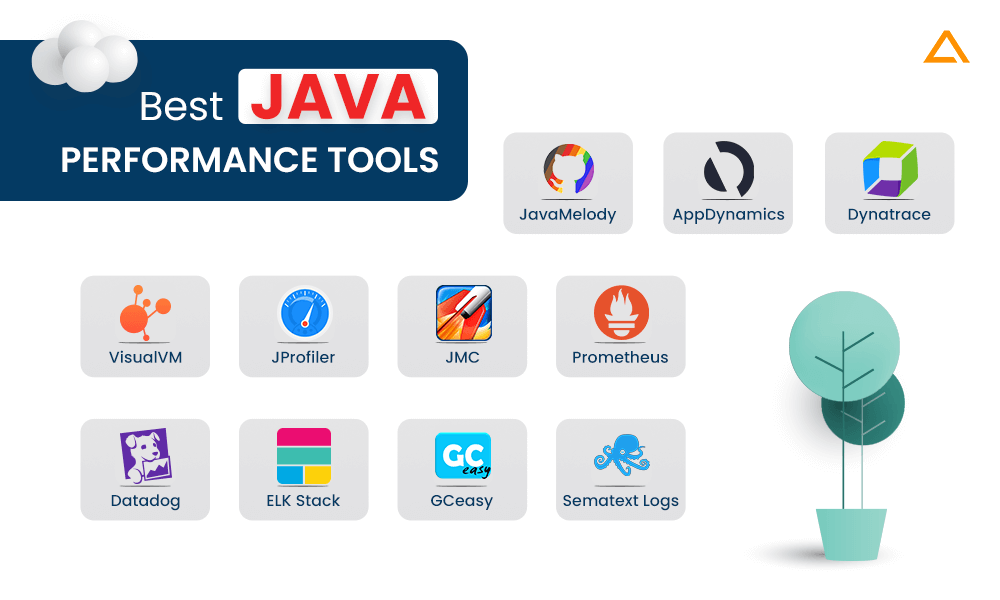
VisualVM: This is a free, open-source tool from Oracle that's specifically designed for Java applications. It provides detailed information about your app's performance, including CPU usage, memory allocation, garbage collection, and more. YourKit: YourKit is another popular profiling tool for Java. It offers detailed insights into CPU usage, memory allocation, and thread activity, making it easy to identify performance bottlenecks. JMC (Java Mission Control): This tool, developed by Oracle, provides a comprehensive view of your application's performance and behavior. JMC allows you to collect data about your app's execution, including garbage collection, CPU usage, and memory allocation. Eclipse Memory Analyzer Tool (MAT): Eclipse MAT is a popular tool for analyzing heap dumps generated by the Java Virtual Machine (JVM). It helps you identify memory leaks and optimize memory usage in your application. Java Flight Recorder (JFR): JFR is a low-overhead, high-fidelity profiling tool that captures detailed information about your app's execution, including CPU usage, memory allocation, and garbage collection. This data can be used to identify performance bottlenecks and optimize your application's behavior. Jprofiler: JProfiler is a comprehensive Java profiler that offers both agent-based and JVM-based profiling capabilities. It helps you identify performance bottlenecks in your application by providing detailed information about CPU usage, memory allocation, and thread activity. OpenTS: OpenTS (Open Tracing) is an open-source tool for tracing and profiling Java applications. It provides a comprehensive view of your app's behavior, including request latency, CPU usage, and memory allocation.When choosing the best performance optimization tools for your Java application, consider the following factors:
Ease of use: Some tools are more user-friendly than others. Overhead: Look for tools that have minimal overhead to avoid impacting your application's performance. Feature set: Consider the specific features you need to optimize your application's performance (e.g., memory analysis, CPU profiling). Cost: Some tools are free or open-source, while others may require a license.By leveraging these powerful Java performance optimization tools, you'll be well-equipped to identify and address bottlenecks in your application, ensuring it runs smoothly and efficiently.
Java performance optimization tools examples
Here are some examples of Java performance optimization tools:
VisualVM: This is a popular Java profiling and monitoring tool that provides detailed insights into the performance of your Java application. It can help you identify memory leaks, CPU bottlenecks, and other performance issues. YourKit: This is another popular Java profiler that provides advanced features for analyzing the performance of your Java application. It includes features such as thread analysis, heap analysis, and system resource monitoring.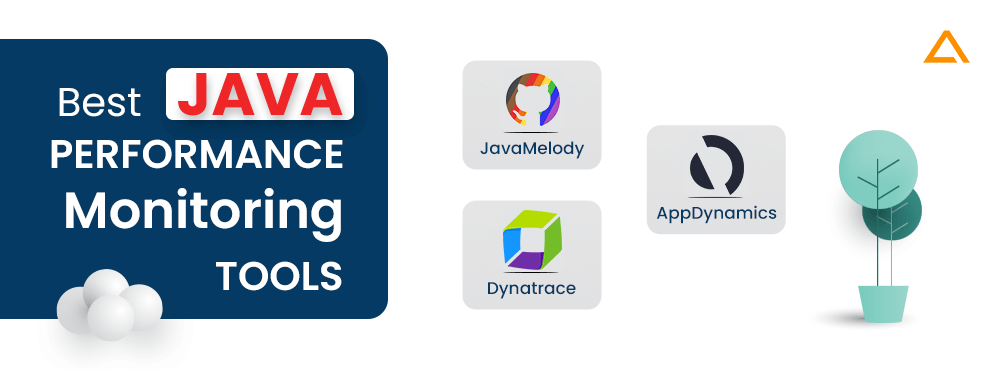
Some best practices for optimizing Java application performance include:
Using efficient algorithms and data structures Minimizing object creation and garbage collection Optimizing database queries and disk I/O operations Using caching to reduce redundant computations Minimizing unnecessary memory allocations Optimizing CPU usage by reducing computation-intensive code Monitoring system resources such as CPU, memory, and disk spaceSome common Java performance optimization techniques include:
Code optimization: This involves optimizing the code itself to make it more efficient. This can include techniques such as loop unrolling, memoization, and caching. Data structure optimization: This involves choosing the most efficient data structures for your application's specific needs. Algorithm optimization: This involves choosing the most efficient algorithms for your application's specific needs. Memory optimization: This involves optimizing memory usage by reducing unnecessary object creation and garbage collection. CPU optimization: This involves optimizing CPU usage by reducing computation-intensive code and minimizing unnecessary computations.Some common Java performance bottlenecks include:
High memory usage: If your application is consuming too much memory, it can lead to poor performance, slow startup times, and increased garbage collection. Slow database queries: If your application is performing slow database queries, it can lead to poor performance, slow response times, and increased system load. High CPU usage: If your application is consuming too many CPU resources, it can lead to poor performance, slow response times, and increased system load. Poor algorithm choices: Choosing the wrong algorithms for your specific needs can lead to poor performance, slow response times, and increased system load. Inefficient data structures: Using inefficient data structures can lead to poor performance, slow response times, and increased system load.In conclusion, there are many Java performance optimization tools available that can help you identify and optimize performance bottlenecks in your application. Some best practices for optimizing Java application performance include using efficient algorithms and data structures, minimizing object creation and garbage collection, optimizing database queries and disk I/O operations, using caching to reduce redundant computations, minimizing unnecessary memory allocations, optimizing CPU usage by reducing computation-intensive code, monitoring system resources such as CPU, memory, and disk space.