How to improve Java performance?
How to improve Java performance?

Here's a comprehensive guide on how to improve Java performance:
1. Optimize your code:
Arrays.sort() or List.sort(). Avoid recursive methods, which can cause stack overflow issues.
2. Profile your application:
Use Java Mission Control (JMC) to profile your application and identify performance bottlenecks. JMC provides a detailed view of your application's memory usage, CPU usage, and other performance metrics.3. Optimize memory management:
Minimize garbage collection pauses by reducing object creation and usingArrays.copyOf() instead of Arrays.asList(). Use System.gc() to trigger garbage collection manually. Consider using a Java profiler like Eclipse MAT or YourKit Profiler to analyze heap usage and identify memory leaks.
4. Leverage Java 8 features:
Use lambda expressions and method references to reduce boilerplate code and improve readability. Take advantage of functional programming features likeStream API for efficient data processing. Use the Optional class to safely handle null values and avoid NullPointerExceptions.
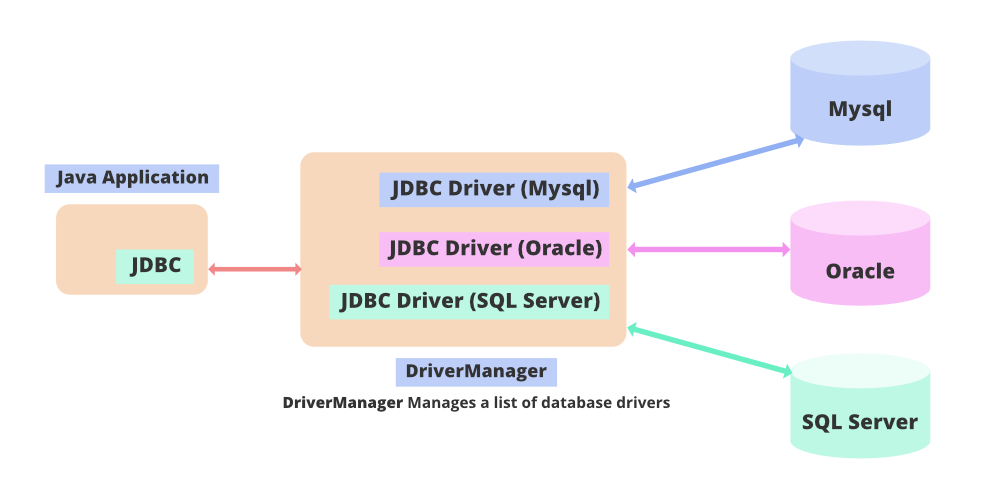
5. Improve database performance:
Use connection pooling and batching to minimize the number of database connections. Optimize database queries by using indexes, views, and stored procedures. Consider using a caching layer like EhCache or Redis to reduce the load on your database.6. Minimize I/O operations:
Use buffering and caching to reduce the number of disk reads and writes. Avoid unnecessary file accesses and use memory-mapped files instead. Optimize file compression and decompression for faster data transfer.7. Optimize network performance:
Use connection pooling and keep-alive headers to minimize socket creation. Optimize HTTP requests by using caching, pipelining, and chunked encoding. Consider using a load balancer or content delivery network (CDN) to distribute traffic and improve response times.8. Monitor system resources:
Use the Java Management Extensions (JMX) API to monitor JVM metrics like CPU usage, memory usage, and garbage collection. Monitor system resources like disk space, CPU usage, and network bandwidth using tools liketop, htop, or iostat.
9. Upgrade your hardware:
Ensure your computer's CPU, RAM, and hard drive are sufficient for the task at hand. Consider upgrading to a solid-state drive (SSD) for faster disk I/O.10. Consider alternative JVMs:
Oracle JDK and OpenJDK are popular choices, but you may also consider alternative JVMs like Azul Zing or GraalVM. Each JVM has its own set of features, performance characteristics, and limitations, so choose the one that best fits your needs.By following these guidelines, you should be able to significantly improve the performance of your Java application. Happy coding!
What is the Java code optimization program?
I'm happy to explain the concept of Java code optimization programs!
Java code optimization refers to the process of modifying and refining existing Java code to improve its performance, efficiency, memory usage, or overall quality. This can be achieved by identifying and addressing potential issues in the code, such as inefficient algorithms, poor data structures, or excessive computational overhead.
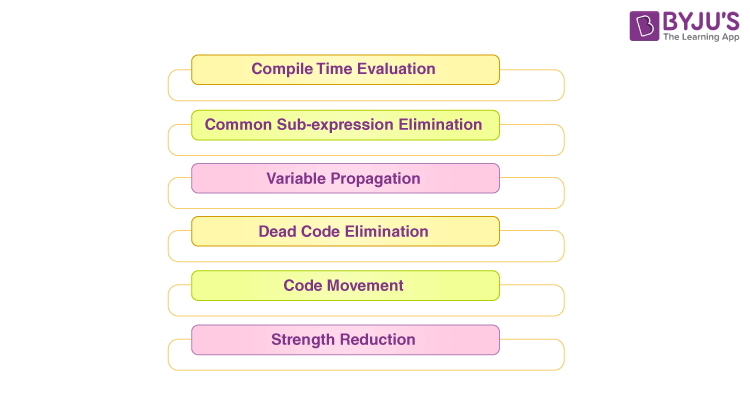
There are several techniques and tools used for Java code optimization:
Profiling: Profilers analyze how an application uses CPU time, memory, and other resources, helping identify performance bottlenecks. Code Review: Thoroughly examining the code to identify areas where optimization can be applied, such as reducing unnecessary computations or improving data access patterns. Algorithm Optimization: Replacing inefficient algorithms with more efficient ones, like switching from a quadratic algorithm to a linear one for sorting large datasets. Data Structure Optimization: Improving data structures by using arrays instead of lists, caching frequently accessed data, or compressing data for better storage and transmission. Garbage Collection: Minimizing the impact of Java's automatic garbage collection on performance by reducing object creation and retention. Caching: Implementing caching mechanisms to reduce redundant computations, I/O operations, or database queries.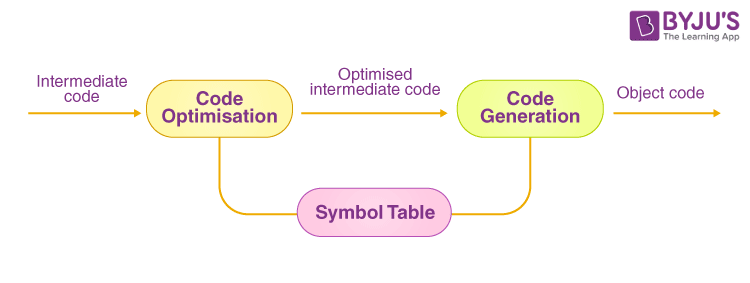

Some popular tools for Java code optimization include:
Eclipse Memory Analyzer Tool (MAT): A visualizer for heap dumps, helping identify memory leaks and optimize object retention. Java Mission Control: A profiling tool for monitoring and analyzing Java applications in real-time. VisualVM: A GUI-based profiler for monitoring and troubleshooting Java applications. JProfiler: A commercial-grade profiler offering detailed performance analysis, code coverage, and thread dumps. YourKit: A memory profiler and analyzer providing insights into object retention and garbage collection.By applying these techniques and using the right tools, developers can significantly improve the performance, reliability, and maintainability of their Java applications, ultimately leading to better user experiences and increased productivity.